
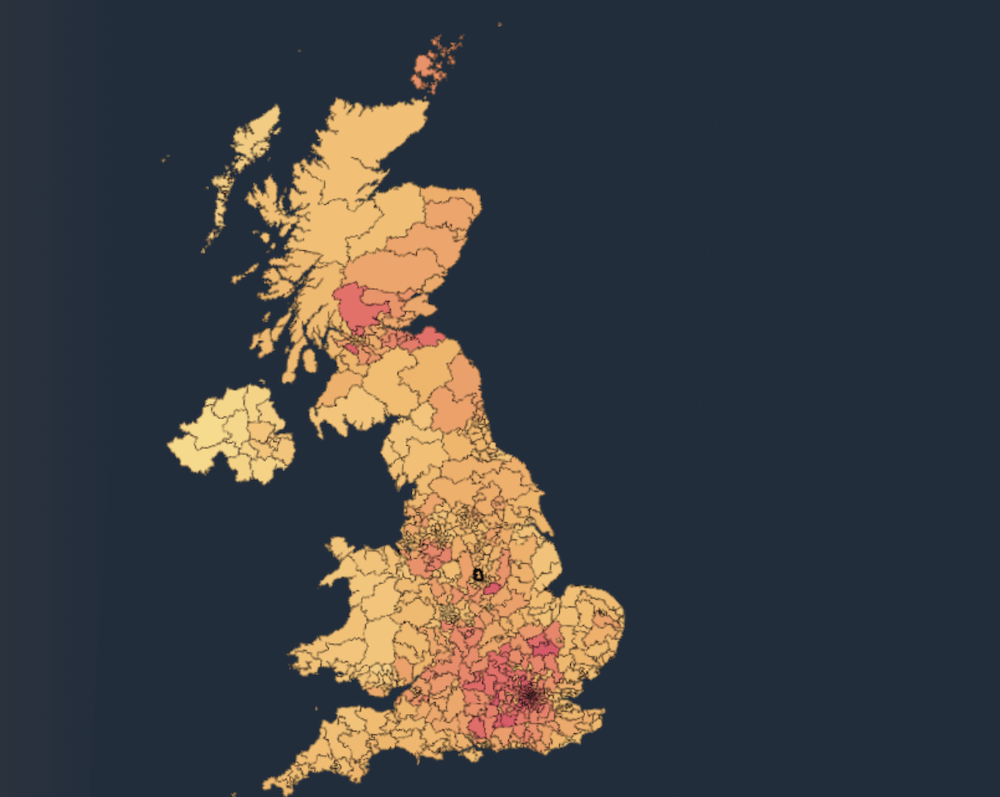
EVA England has launched its updated Constituency Map, offering England’s most detailed snapshot of how local communities are progressing in the transition to electric driving.
Developed by Field Dynamics, with input from Zapmap, the Map provides a constituency-level breakdown of EV uptake and the availability of public charging infrastructure in each constituency in England.
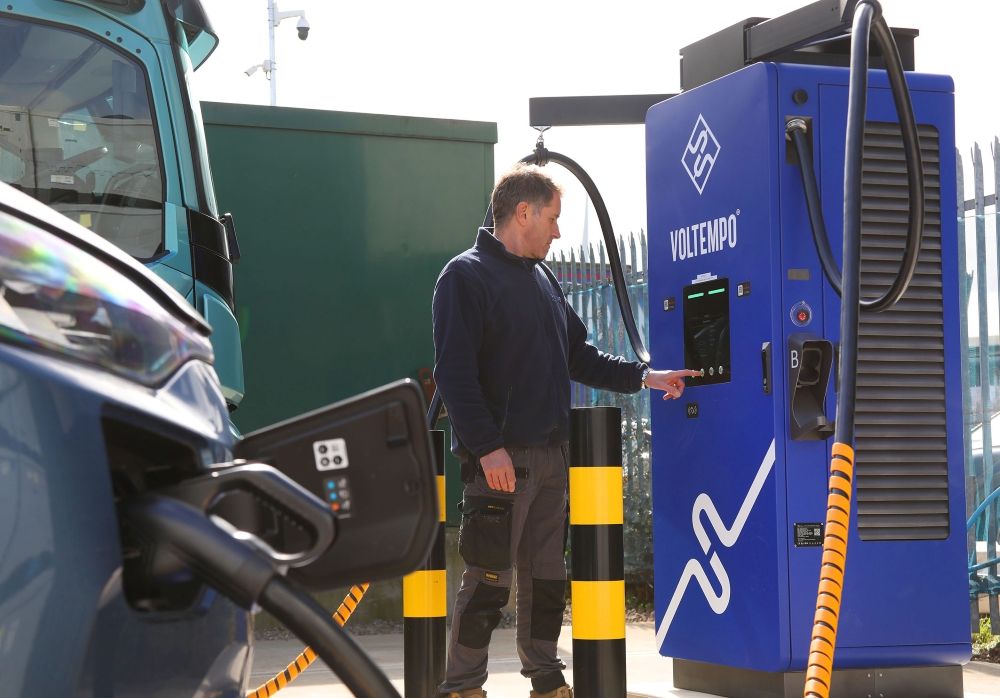
The map was launched at the GRIDSERVE Electric Forecourt in Stevenage, which has 30 charging bays powered solely by net-zero energy.
The release comes two years after EVA England published its first version of this map. Since then, the EV landscape has changed significantly: EVs now make up nearly a quarter of all new car sales; public chargepoints have grown to more than 86,000; and consumer confidence continues to rise.
EVA England’s own annual driver survey shows 95% of EV drivers would recommend electric vehicles to friends and family, while two-thirds of petrol and diesel drivers say they are considering an EV for their next car.
For the first time, the updated map demonstrates how each region and local community is progressing in supporting greater use of EVs by rolling out charging infrastructure to serve drivers without access to private charging.
The map reveals that the top 5 constituencies so far, for households without access to off-street parking that are within a five-minute walk of a charger are:
- Queen’s Park and Maida Vale
- Peckham
- Kensington and Bayswater
- Islington South and Finsbury
- Hackney South and Shoreditch
Within all of these boroughs, over 99% of households are within reach of a chargepoint, and in Queens Park and Maida Vale, and Kensington and Bayswater, over 10% of cars within the borough are electric.
Outside of London, Coventry and Brighton are demonstrating considerable progress in rolling out charging infrastructure, with just under 90% of households in Coventry South within five minutes of a charger, which should support more and more drivers in switching to electric in those areas.
The map also shows the areas of England where EV uptake (defined as the estimated number of EVs as a proportion of all vehicles in the constituency) is lagging behind, and where more effort is needed to show drivers that these cars can work for them. The bottom 5 constituency areas for EV uptake, where 2% or less of vehicles in the area are electric, are:
- Smethwick
- West Bromwich
- Plymouth Sutton and Devonport, and Plymouth Moorview
- Tipton and Wednesbury
- Kingston upon Hull
More broadly, the map allows local authorities, chargepoint operators, policymakers, and residents to understand how their constituency compares to neighbours and to regional averages. It highlights where public charging is keeping pace with demand – and where urgent action is needed.
It shows:
- The proportion of households using EVs in every constituency.
- The number and type of public chargepoints available locally, including slow, fast, rapid and ultra-rapid infrastructure.
- How each constituency compares with nearby areas and the wider region.
- Where consumers’ growing demand for EVs is being matched by public charging – and where it is not.
Vicky Edmonds, Chief Executive of EVA England, said:
“We built this Map to shine a light on the real-world experience of drivers using and charging their cars within the communities they live in. EVA England is focused on making sure that policy and industry decisions are grounded in the lived experience of EV drivers. Only then can we make the transition to electric work for everyone.
“The updated map shows clear areas of progress, in both attracting drivers into EVs and also in the charging infrastructure available to them, but also clear gaps. Continued collaboration across industry and government will be essential, and so will the voices of EV drivers who understand the day-to-day reality of driving and charging these vehicles better than anyone.”
Craig Stephenson, Managing Director at Field Dynamics, said:
“EVA England have been the driving force behind this tool from day one. Their focus on representing the real experiences of EV drivers shaped every aspect of how the map works and what it reveals. Our role at Field Dynamics has been to take that vision and turn it into a data-driven, constituency-level picture of EV uptake and charging provision, working closely with Zapmap to ensure the charging landscape is represented accurately and transparently
“The result is a tool that empowers communities, informs policy, and highlights where progress is being made and where support is still urgently needed. We’re proud to have supported EVA England in bringing this to life.”
Jade Edwards, Head of Insights, Zapmap said:
“We’re delighted to contribute to EVA England’s Constituency map by providing the latest Zapmap charge point locations data. This provides an up-to-date view of EV charging available across near-home, destination and en-route charging at a detailed local level.
“The map offers valuable insights to support ongoing EV adoption while enabling LAs and policy makers to understand the current local charging landscape. This will help them advocate for charging provision to meet constituents’ needs while also ensuring sufficient charging for local businesses and visitors to the area.”
Maz Shar, Board Director for Data at EVA England, said:
“Using data to drive informed decision-making is vital. This expanded constituency map gives MPs and residents a clear view of how their area is progressing in the transition to electric vehicles. With new metrics, and a more intuitive way to compare constituencies it will help empower those involved in the EV transition to accelerate progress in their area.
“As someone who has driven 40 000 miles without access to private charging, I’m especially focussed on how well areas without home charging are performing.”
Image courtesy of EVA England