
The latest electric vehicle charging statistics released by the Department for Transport (DfT) show that as of 1 January 2023 there were 37,055 public electric vehicle charging devices installed in the UK, an increase of 2,418 compared to 1 October 2022.
When looking at charging speed, 6,887 were rated “rapid” devices or above, this represents 19% of all charging devices. 21,255 were rated “fast” chargers, which represents 57% of all charging devices.
18,321 were designated as “destination” chargers, which represents 49% of all charging devices. 11,996 were designated as “on street” chargers, representing 32% of all charging devices
Compared to 1 October 2022, the total installed devices increased by 2,418, an increase of 7%. Rapid charging or above devices increased by 492, an increase of 8%. There was an increase in total charging devices and those rated rapid or above in all regions of the UK.
Public charging devices by charging speed, since 1 January 2022 (table EVCD_02b)

The chart above compares the relative growth in charging devices in all speed categories seen across 2022. Proportionately, the largest increase in installations was within the ultra-rapid device category, which increased by 10% in the last quarter (albeit from a lower base than other categories), accounting for 211 charging devices. Ultra-rapid charging devices are still the smallest overall category with 2,295 devices.
Proportionately, the smallest increase in charging devices installations was in the slow charging devices categories, with an increase of 5% or 417 charging devices. Fast charging devices are still the most common category to be publicly installed, growing by 8% or 1,509 devices.
Public charging devices by destination of charging device 1 January 2023 (table EVCD_03)

The chart above shows the most common location category for charging devices is “destination” with 18,321 charging devices or approximately half of all publicly available charging devices. “On street” charging devices is the second largest category accounting for 32% of charging devices or 11,996.
There is an uneven geographical distribution of charging devices within the UK. Some UK local authorities have bid for UK Government funding for charging devices, and others have not. Most of the provision of this infrastructure has been market-led, with individual charging networks and other businesses (such as hotels) choosing where to install devices.
Chart 5: Public charging devices per 100,000 of population by UK country and region: 1 January 2023 (table ECVD_01a)

Chart 6: Public rapid charging or above devices per 100,000 of population by UK country and region: 1 January 2023 (table ECVD_01b)

Chart 5 (above) and Map 1 (below) show that London and Scotland had the highest level of charging provision per 100,000 of population, with 131 and 69 devices per 100,000 respectively. In comparison, the average provision in the UK was 55 per 100,000.
Northern Ireland had the lowest level of charging device provision in the UK, with 19 devices per 100,000, followed by the North West and Yorkshire and the Humber with 31 and 36 devices per 100,000 respectively.
Chart 6 and Map 2 indicate that Scotland had the highest rate of rapid device provision of 17.3 rapid or quicker devices per 100,000, whilst the average provision in the UK was 10.3 per 100,000. Rapid or quicker device provision was lowest for Northern Ireland with 1.4 rapid or quicker devices per 100,000. North West and East of England were the second and third lowest regions with 8.3 and 8.9 rapid or quicker devices per 100,000 respectively.
Maps 1 and 2: Total and rapid or above public charging devices per 100,000 of population by UK region 1 January 2023

Maps 3 and 4: Change in public charging devices, per region between October and December 2022; percentage and (number of devices)

As Map 3 shows all regions across the UK saw an increase in total charging devices between October and December 2022. Wales had the greatest increase at 17.3%, whilst East Midlands had the smallest increase at 3.3%. London had the greatest increase in absolute number of devices at 493 devices, closely followed by Scotland at 486 devices.
The number of available devices can fluctuate for a range of reasons. Increases likely reflect the installation of new devices, whilst owners and operators can choose to temporarily or permanently decommission or replace devices. Charging devices can also be unavailable due to faults, maintenance or other restrictions in the area where they are located, though data on the status of charging devices is not held by Department for Transport.
Map 4 shows that rapid charging or above devices have increased in every region in the UK. The smallest percentage increase in the number of rapid charging or above devices was South East at 3.3%. Wales had the largest percentage increase in rapid charging or above devices at 26.9%, corresponding to an increase of 60 rapid charging or above devices.
Industry reaction
Tom Hurst, UK Lead at Fastned, said: “Drivers will be pleased that more charging options are arriving each day, but we must go further. A vital way to accelerate the transition is through reform of the planning permissions process for charging stations.
“Charge point operators (CPOs) are ready to invest millions in the UK, but cumbersome regulations are slowing the rollout down and providing a worse charging experience for drivers. With up to 24 months between initial conversations and opening a new site, stations can only open as quickly as local councils and planning officers allow.
“That means now is the opportune moment for the UK to trial a “trusted provider status” programme, to reward CPOs who build quality sites and connect local communities up and down the UK.”
Images and graphics courtesy of DfT/Zap-Map. Original source: https://www.gov.uk/government/statistics/electric-vehicle-charging-device-statistics-january-2023/electric-vehicle-charging-device-statistics-january-2023
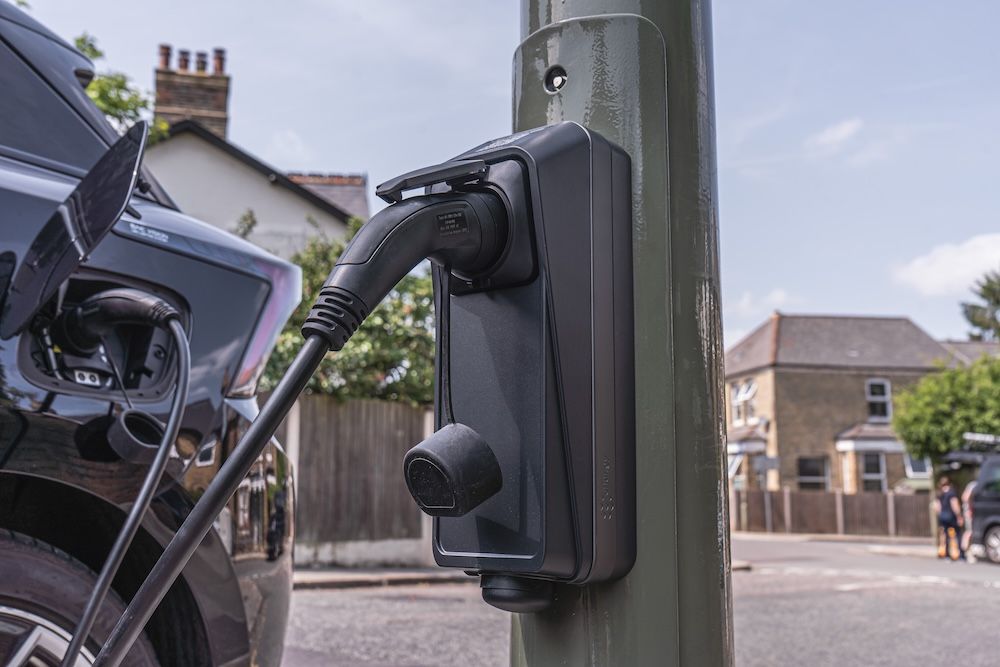
Main picture courtesy of Shutterstock.