
New analysis from Zap-Map, the UK’s leading charge point mapping service, has found that the price EV drivers are paying to charge an electric vehicle (EV) on the public network has increased by 14% since June.
Zap-Map’s analysis takes into account more than 500,000 charging sessions per month, across approximately 70% of the charge points in the UK.
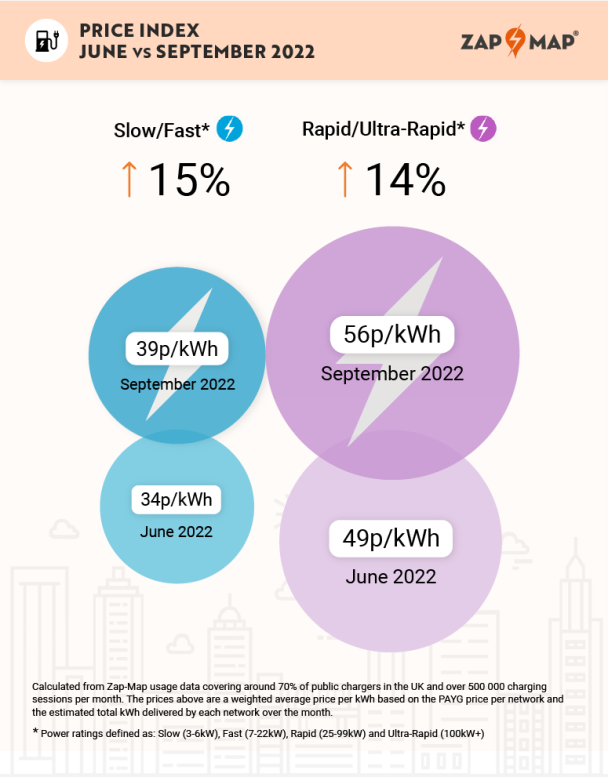
The findings show that, in September 2022, the average weighted price of charging at a slow or fast charger – typically found on-street or at a destination such as supermarkets or car parks – was 39p/kWh in the UK, while the price for a rapid or ultra-rapid charge point, typically used for high speed en-route charging, was 56p/kWh*.
This means that prices for slow/fast charge points were up 15% from 34p/kWh in June 2022, with prices for rapid/ultra-rapid chargers up 14% in the same period, from 49p/kWh.
Primarily as a result of restricted gas supplies and geopolitical instability, wholesale electricity prices have increased dramatically in 2022, with the UK seeing a new record high peak in September. It is a trend that has pushed charge point operators’ costs higher than ever, with these increasing costs inevitably being passed on to EV drivers using public networks.
Despite this, it is still cheaper to run an electric vehicle than an internal combustion engine (ICE) vehicle. Although the cost of charging on the public network is increasing, EV drivers can still save versus driving an ICE car, wherever they tend to charge.
For example, a driver charging at home 80% of the time would save around £1,200 per year versus an ICE car, while a driver charging solely on the public network using a combination of slow/fast and rapid/ultra-rapid charging would save around £900 per year.
Due to this difference in costs, Zap-Map is one of a number of organisations backing the FairCharge campaign, which aims to reduce the rate of VAT on public charging and so bring down costs for EV drivers without access to a home charger.
According to Zap-Map’s latest annual EV Charging Survey – which saw responses from more than 4,300 EV drivers across the UK – 84% of respondents have access to a home charger, with 36% of users saying they use the public network less than once per month.
In addition, 44% of respondents stated that reducing running costs was the main motivation for buying their EV. As such, many are keeping a close eye on the rising costs of electricity, with 41% of drivers concerned about the high cost of charging – up from 33% in 2021.
Yet confidence in EV running costs being economical remains high. Over 80% of EV drivers are confident that their EV is currently cheaper to run than the equivalent ICE vehicle. Looking ahead, however, this figure does drop a little: around 75% are confident that the same will be true by January 2023.
To keep track of the prices that EV drivers pay when charging on the public charging network, Zap-Map has published a new Price Index. Through the data collected to drive the Zap-Map app, the Price Index tracks over 500,000 charge sessions each month and updates to charge point operator prices to provide the latest public EV charging prices on a quarterly basis. Find out more from Zap-Map’s Price Index.
Melanie Shufflebotham, Co-founder & COO at Zap-Map, said: “Although the results of our survey show many EV drivers are keeping a close eye on the rising costs of electricity, it’s still significantly cheaper to run an electric car than a petrol or diesel vehicle.
“With cost savings front of mind for people across the country, the Zap-Map Price Index highlights that the price EV drivers pay varies a good deal across different charging scenarios.
“With more and more drivers switching to electric, the purpose of Zap-Map’s new Price Index is to keep track of the price that EV drivers pay when out and about, as well as how it varies across the different types of chargers. This will in turn help EV drivers to to seek out the cheapest charging option and keep their costs firmly under control.”
Main image courtesy of Shutterstock.