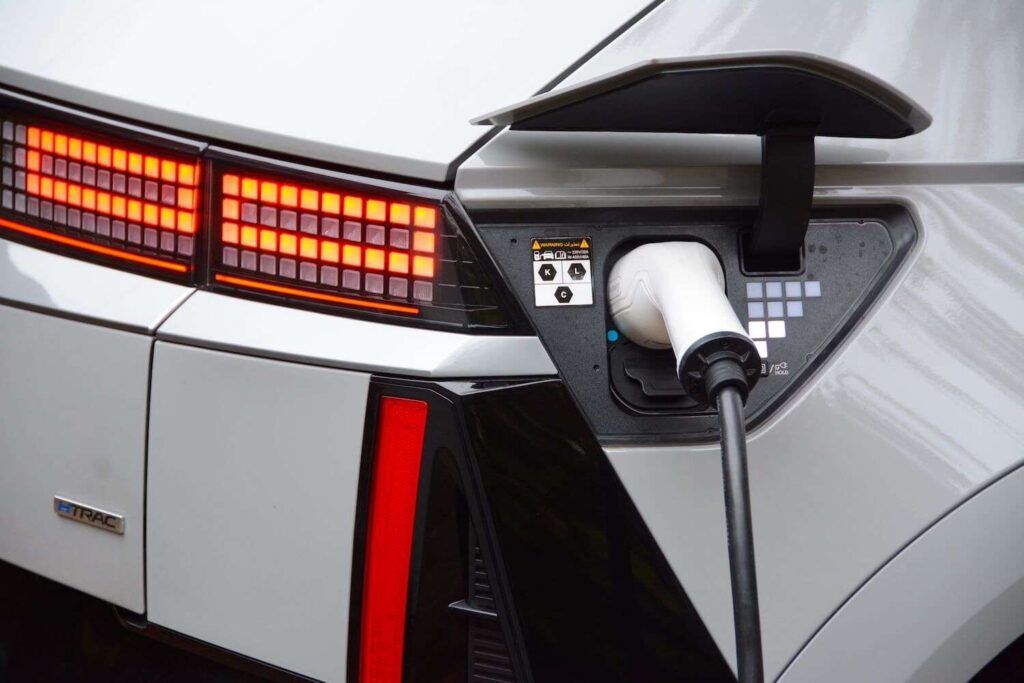
The latest electric vehicle charging statistics released by the Department for Transport (DfT) show that since 1 July 2021 the number of public devices has increased by 31%, corresponding to a total of 7,637. The number of rapid devices increased by 31%, with an additional 1,423.
But whilst the statistics show that progress is being made, over the last few years growth has been uneven across the country, with some areas seeing far slower growth than others.
As of 1 July 2022:
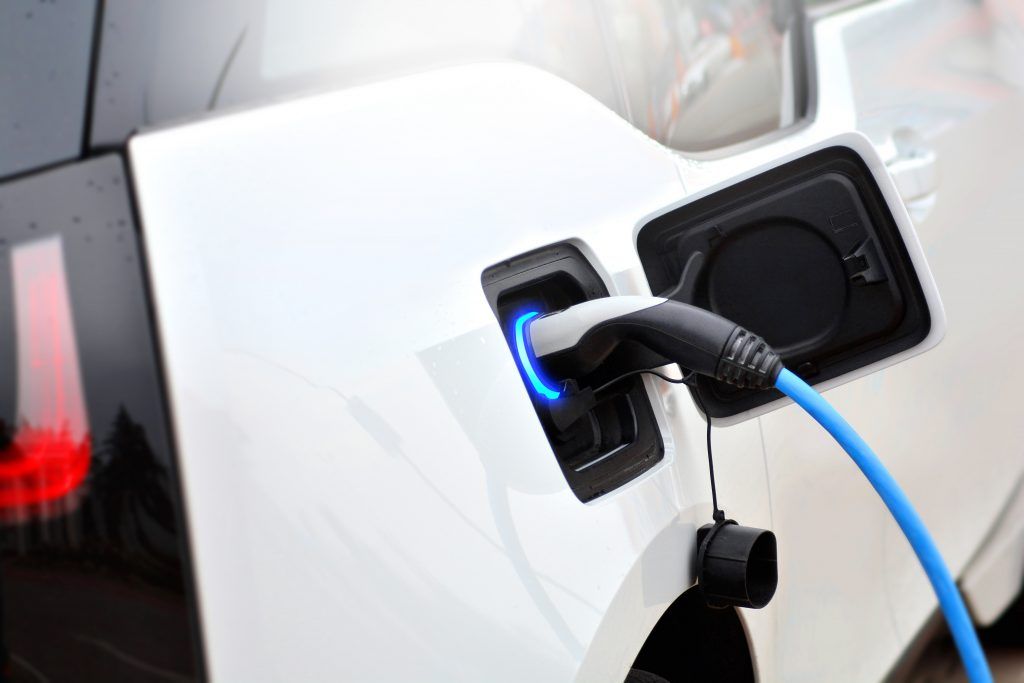
- There were 32,011 public electric vehicle charging devices available in the UK
- Of the total devices available, 5,974 were rapid chargers
Compared to 1 April 2022:
- Available devices increased by 1,721, an increase of 6%
- Rapid devices increased by 480, an increase of 9%
- Aside from Northern Ireland, there was an increase in total and rapid devices across all regions of the UK
The table below shows the change in the number of devices since 2015.
Chart 1: Growth in UK public charging devices since 2015 (table EVCD_02)

Regional distribution of charging devices
There is an uneven geographical distribution of charging devices within the UK. Some UK local authorities have bid for UK Government funding for charging devices, and others have not. Most of the provision of this infrastructure has been market-led, with individual charging networks and other businesses (such as hotels) choosing where to install devices.
Chart 3: Public charging devices per 100,000 of population by UK country and region: 1 July 2022 (table ECVD_01a)

Chart 4: Public rapid charging devices per 100,000 of population by UK country and region: 1 July 2022 (table ECVD_01b)

Chart 3 and Map 1 show that London and Scotland had the highest level of charging provision per 100,000 of population, with 116 and 55 devices per 100,000 respectively. In comparison, the average provision in the UK was 48 per 100,000.
Northern Ireland had the lowest level of charging device provision in the UK, with 17 devices per 100,000, followed by the North West and Yorkshire and the Humber with 27 and 29 devices per 100,000 respectively.
Chart 4 and Map 2 indicate that Scotland had the highest rate of rapid device provision of 14.2 rapid devices per 100,000, whilst the average provision in the UK was 8.9 per 100,000. Rapid device provision was lowest for Northern Ireland with 1.1 rapid devices per 100,000. North West and Wales were the second and third lowest regions both with 6.7 rapid devices per 100,000 respectively.
Maps 1 and 2: Total and rapid public charging devices per 100,000 of population by UK region 1 July 2022

Maps 3 and 4: Change in public charging devices, per region between April to June 2022; percentage and (number of devices)

As Map 3 shows all regions, apart from Northern Ireland, across the UK saw an increase in total charging devices between April and June 2022. North East had the greatest increase at 14.2%, whilst Scotland had the smallest increase at 1.2%. London also had the greatest increase in absolute number of devices at 462 devices, contributing to 27% of the increase in devices across the UK in this period. Northern Ireland saw a decrease in the number of chargepoints by 5.7%, this represents 20 devices.
Map 4 shows that rapid charging devices have increased in every region apart from Northern Ireland in the UK. The smallest percentage increase in the number of rapid devices was in London at 3.3%. East of England had the largest percentage increase in rapid devices at 18.7%, corresponding to an increase of 82 rapid devices. Northern Ireland saw a decrease of 16% compared to April 2022, this attributes to a reduction of 4 rapid charge points.
Industry reaction:
Csilla Heim, UK Country Director at Easee, said: “We’re seeing more and more drivers in the UK switching to electric vehicles which is fantastic news for the planet. But one of the biggest barriers stopping more drivers from investing in a battery-powered car is a lack of public chargers. This data shows that progress is being made, but over the last few years it has been uneven across the country, with some areas seeing far slower growth than others. This needs to change so that the transition to electric vehicles becomes as accessible as possible for as many people as possible.”
RAC head of roads policy Nicholas Lyes said: “It’s encouraging to see the number of public chargepoints continues to grow, but it’s concerning the pace of new installations is not keeping up with the growth in new electric vehicles coming on to our roads. As a consequence, our analysis shows that the number of electric vehicles per public chargepoint is increasing – this is especially important with slower chargepoints which require longer stays as fewer vehicles can use them. The Government has set mandates for manufacturers to ensure a proportion of the vehicles they sell are zero-tailpipe emission, so it would be sensible for them to set annual targets for new chargepoints too.
“While more ultra-rapid chargers have come online we believe there should be even more focus on these so that EV drivers can always recharge quickly and easily on long journeys. In addition, this will also give prospective EV owners the confidence to make the switch to electric as soon as possible, particularly if they would not be able to charge at home.”
Images and graphics courtesy of DfT/Zap-Map. Original source: https://www.gov.uk/government/statistics/electric-vehicle-charging-device-statistics-july-2022/electric-vehicle-charging-device-statistics-july-2022
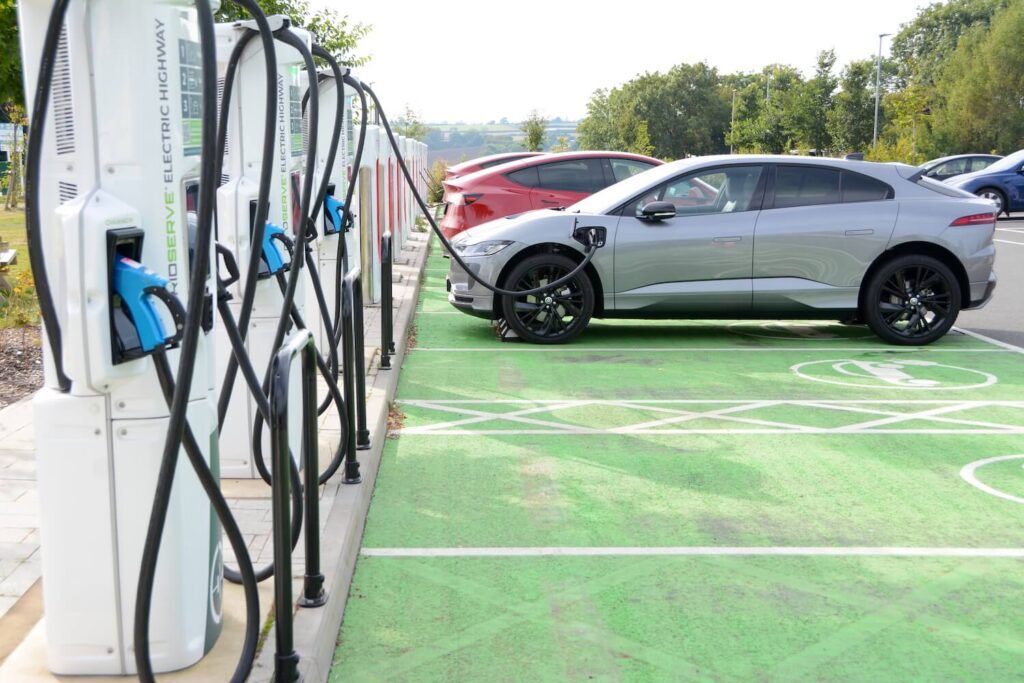
Main image courtesy of Shutterstock.